Derived Play: Chart Lie Detector
Create one polished public-gallery concept image titled exactly "Derived Play: Chart Lie Detector". Use case: infographic-diagram...
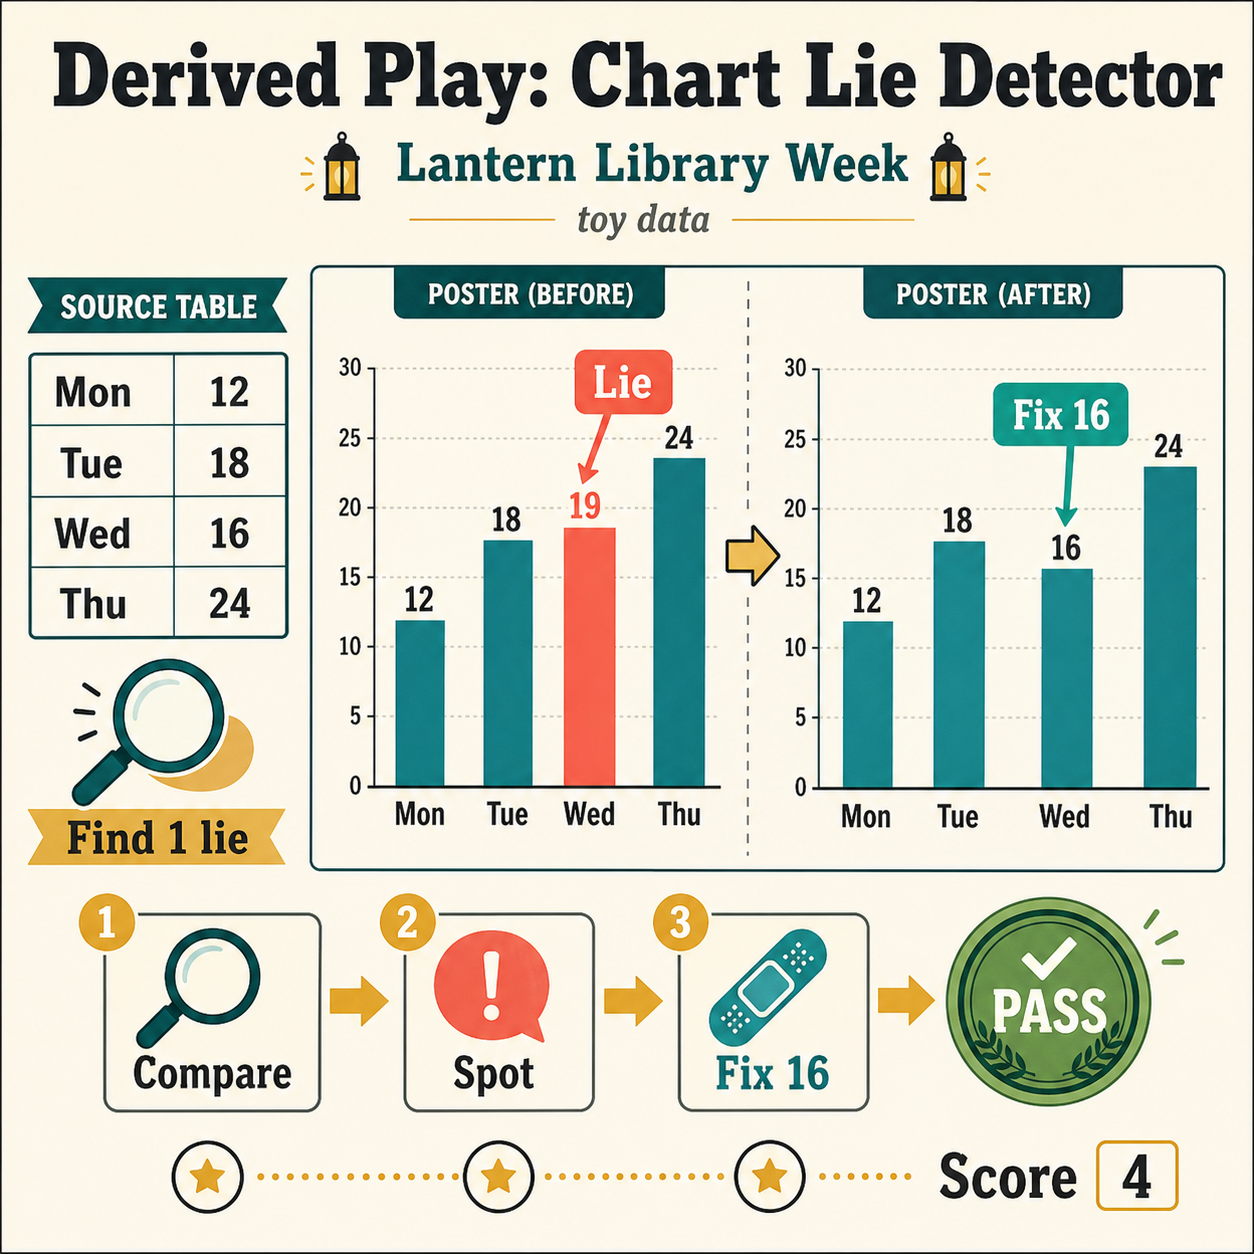
一个 GPT Image 2 数据可视化校验玩法:把虚构 Lantern Library Week 的 Mon 12、Tue 18、Wed 16、Thu 24 toy data 生成成柱状图海报,并用 Title、Units、Order、Values、Scale、Source 和 PASS 4 证明图表与源数据一致。
可参考这个示例来设计 Chart QA、Data Poster Proof、Data To Infographic、Infographic Fidelity 工作流、提示词结构、视觉约束和结果检查方式。
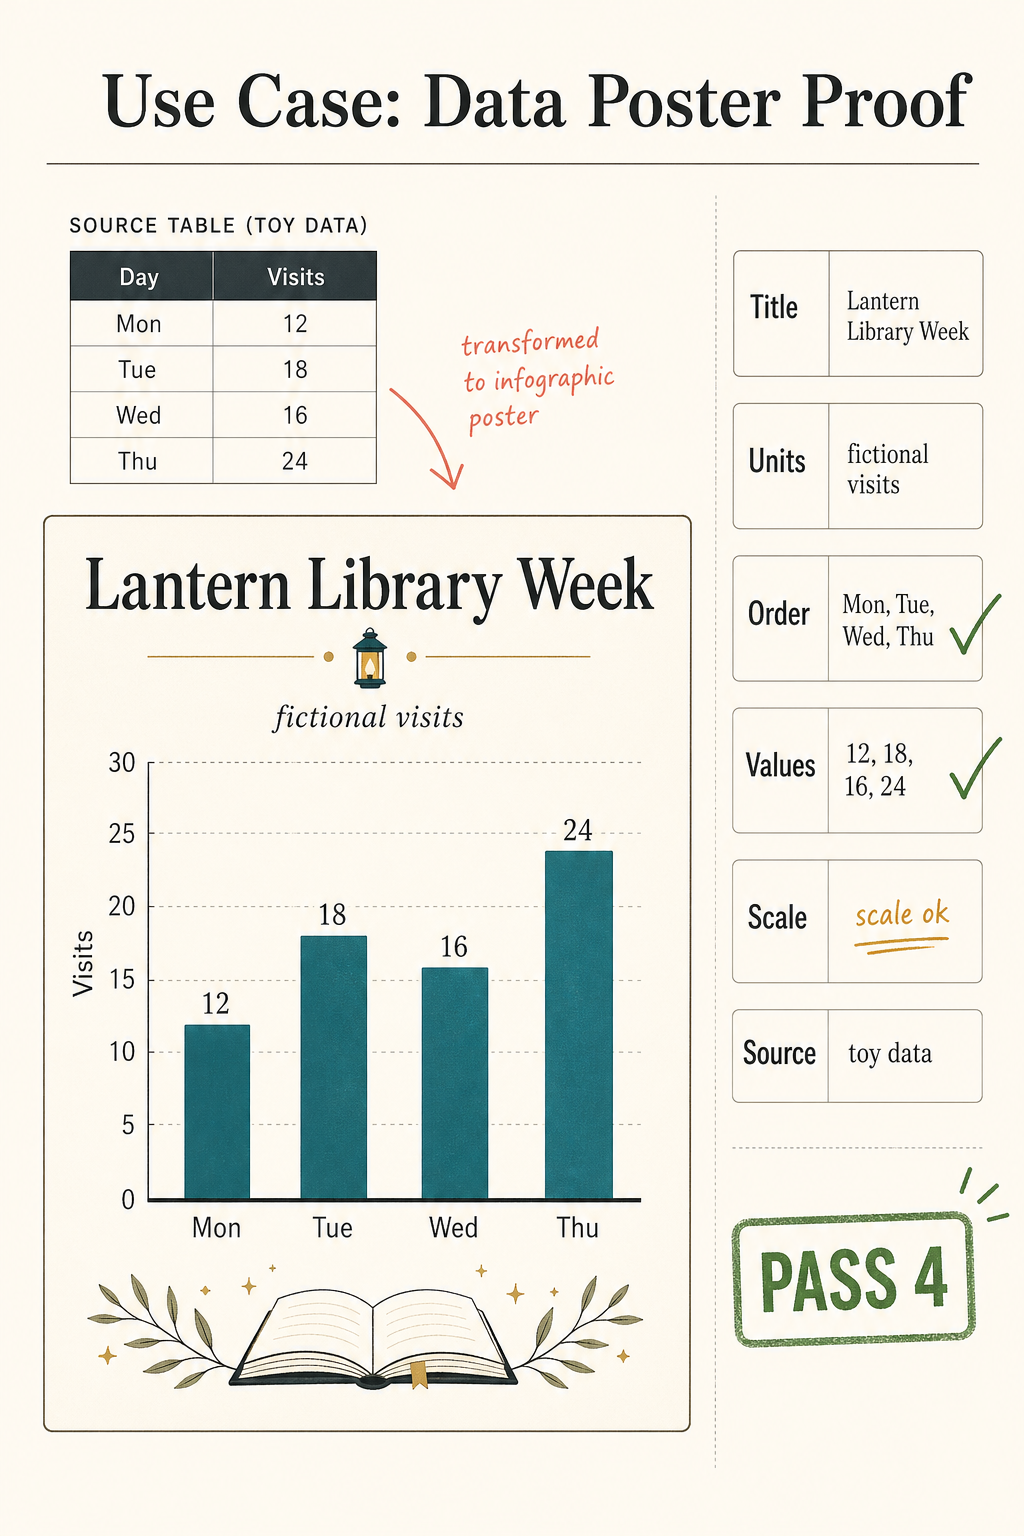
Create one polished public-gallery concept image titled exactly "Use Case: Data Poster Proof".

Use case: infographic-diagram / productivity-visual
Asset type: public GPT Image 2 use-case gallery image, vertical 4:5 flat editorial proof artifact

Primary request: Show GPT Image 2 as a data-to-infographic reliability workflow. A tiny fictional source table is transformed into a clean infographic poster, with visible QA marks that prove the generated chart matches the source data. The artwork must feel like a finished design review artifact, not a generic dashboard, not a classroom worksheet, not a route map, not a comic, not a physical product photo, not a tray or lab bench, and not a multi-image contact sheet.

Scene/backdrop: a flat ivory editorial poster preview for a fictional community reading program called "Lantern Library Week". Use only invented data. The source table has four rows: "Mon 12", "Tue 18", "Wed 16", "Thu 24". The main chart is a simple vertical bar chart using those four values in the same order. Add a small subtitle: "fictional visits". Include a right-side proof strip with compact chips: "Title", "Units", "Order", "Values", "Scale", "Source", "PASS".

Mechanism to make visible: the image demonstrates that generated infographics need fact checking. Show subtle human review marks: green checks next to Order and Values, a tiny amber note reading "scale ok", a source label reading "toy data", and a final green stamp reading "PASS 4". Keep all numbers short and legible. Do not add random placeholder text.

Exact readable text to render: "Use Case: Data Poster Proof", "Lantern Library Week", "fictional visits", "Mon 12", "Tue 18", "Wed 16", "Thu 24", "Title", "Units", "Order", "Values", "Scale", "Source", "toy data", "scale ok", "PASS 4".

Visual style: sophisticated data-journalism poster design, crisp vector-like chart shapes, warm ivory paper, graphite typography, teal bars, amber annotations, moss green pass marks, small coral warning accents used sparingly, accessible contrast, generous margins, precise alignment, lightweight hand-review marks. Make it look distinct from AI poster tropes and from a software analytics dashboard.

Safety and rights: fictional dataset and fictional community program only. Use no real brands, no trademarks, no logos, no real organizations, no real people, no public figures, no politics, no elections, no medical/legal/financial advice, no dangerous instructions, no adult or explicit content, no gore or violence, no copyrighted characters, no living-artist style imitation, no source image reuse, no watermark.
来源说明: Created after a fresh external source sweep. External sources informed only abstract patterns around prompt-gallery metadata, descriptive prompt structure, chart/infographic evaluation, data visualization clarity, and chart-clutter failure modes. No external prompt text, image, source image, real data, brand, character, artwork, or protected style was reused.
Create one polished public-gallery concept image titled exactly "Derived Play: Chart Lie Detector". Use case: infographic-diagram...
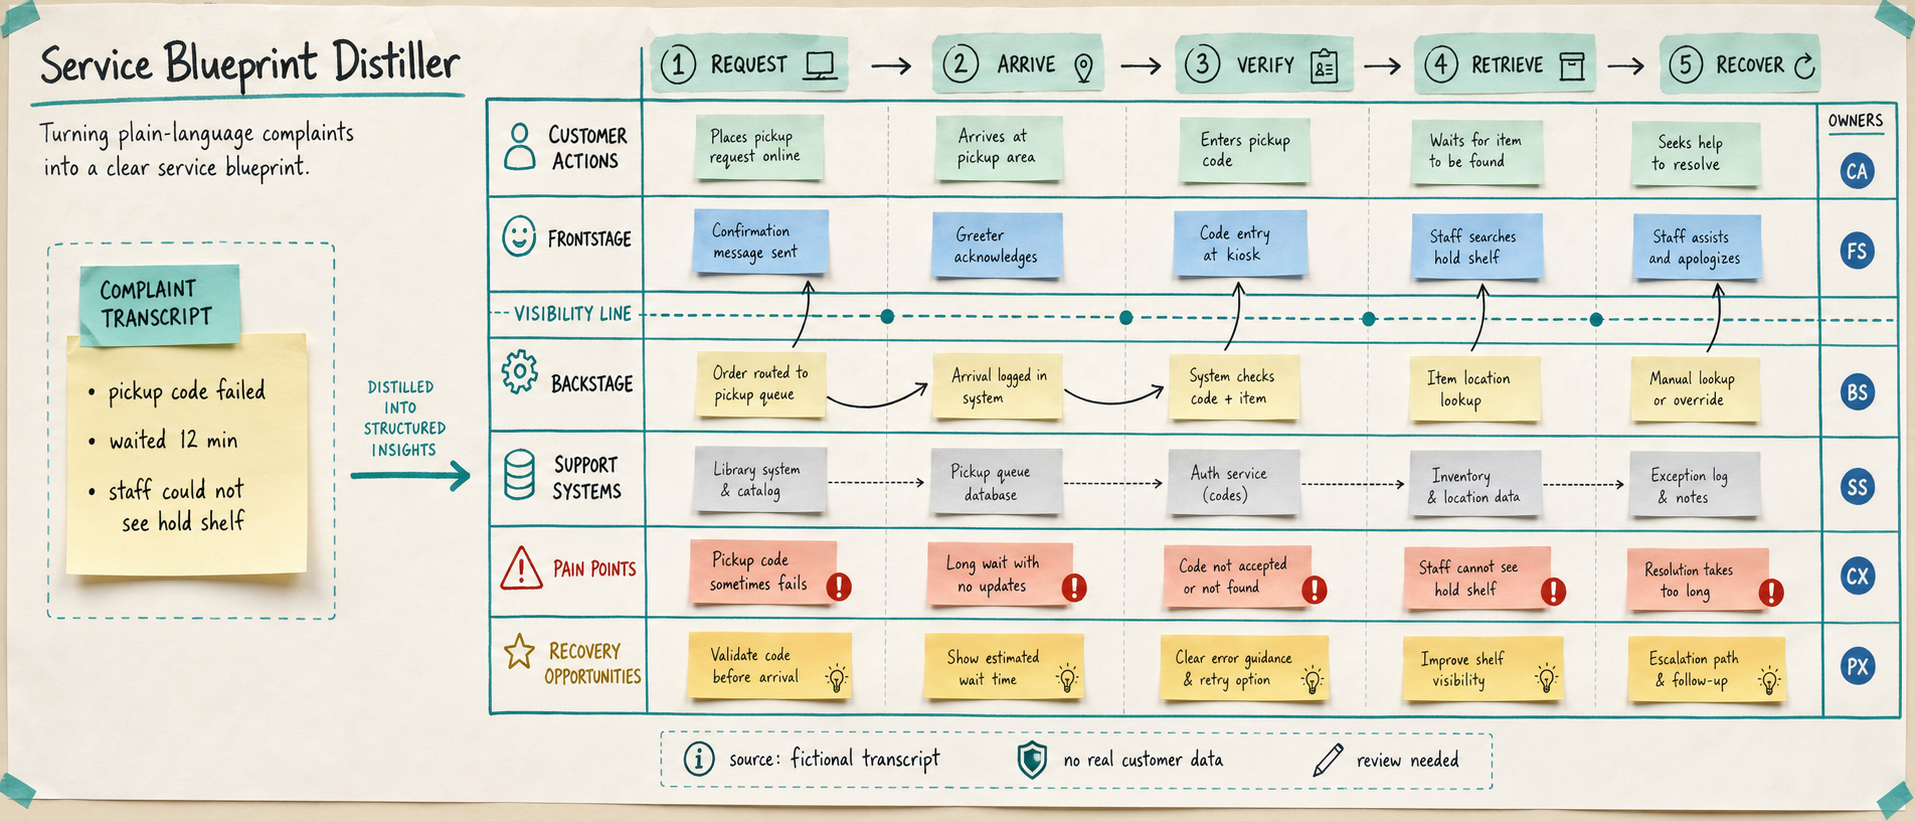
Use case: productivity-visual / service-design workflow Asset type: public gallery image for GPT Image 2 use-case research, ultra...
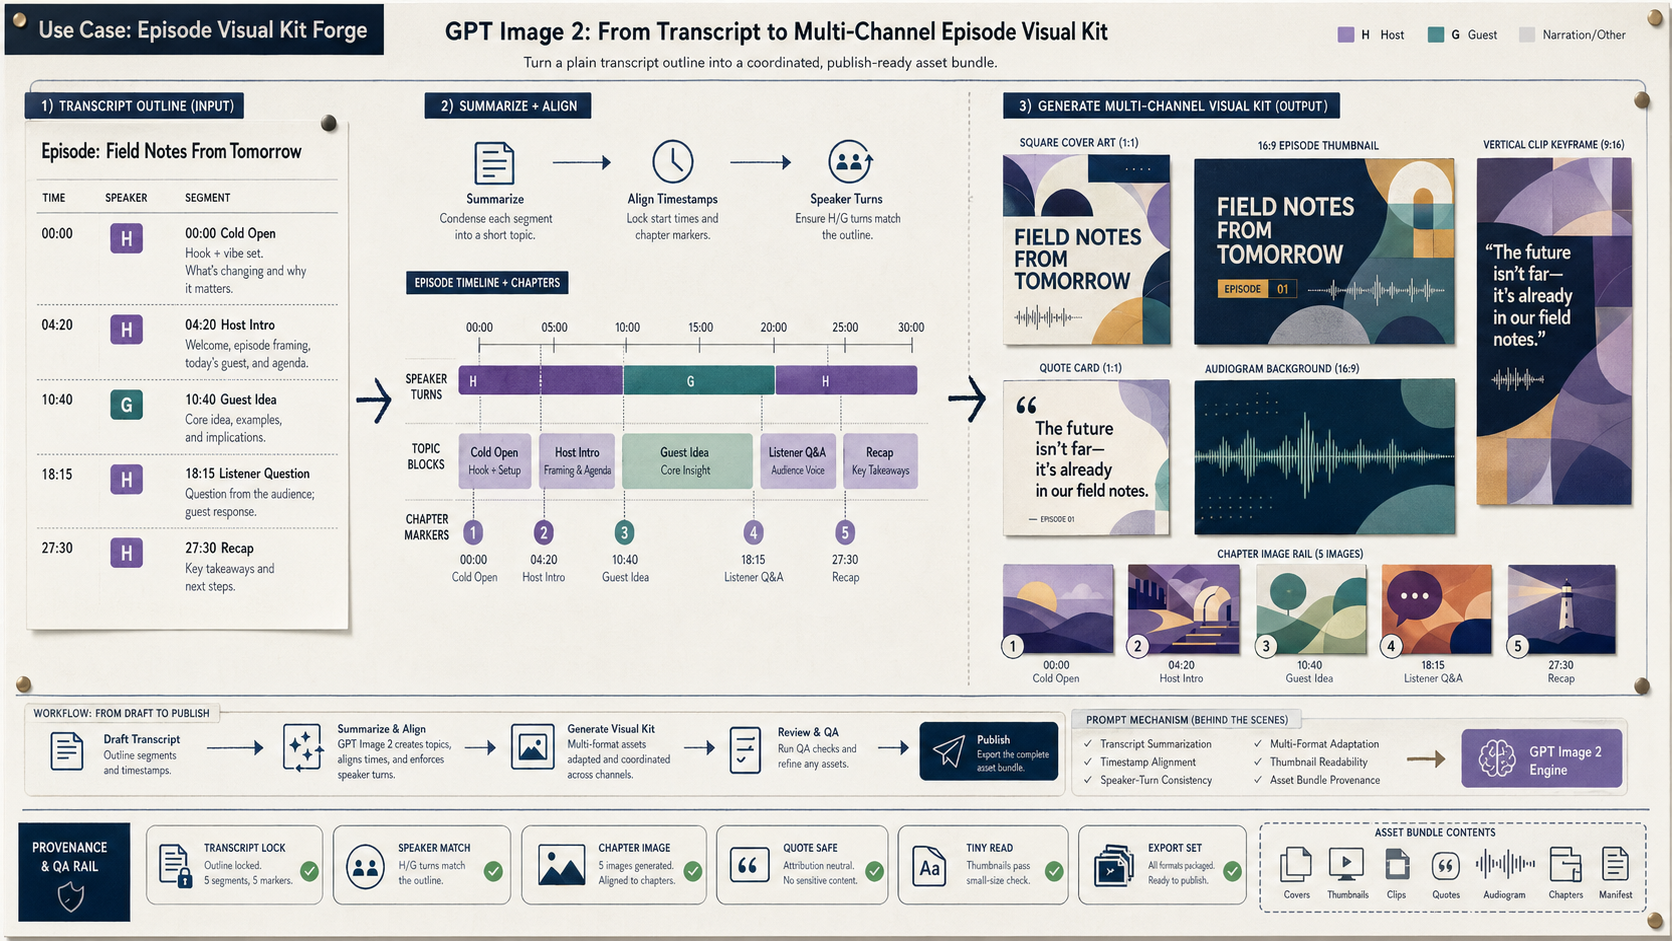
Create a wide 16:9 fictional podcast production artifact titled in small clear text "Use Case: Episode Visual Kit Forge". Show ho...
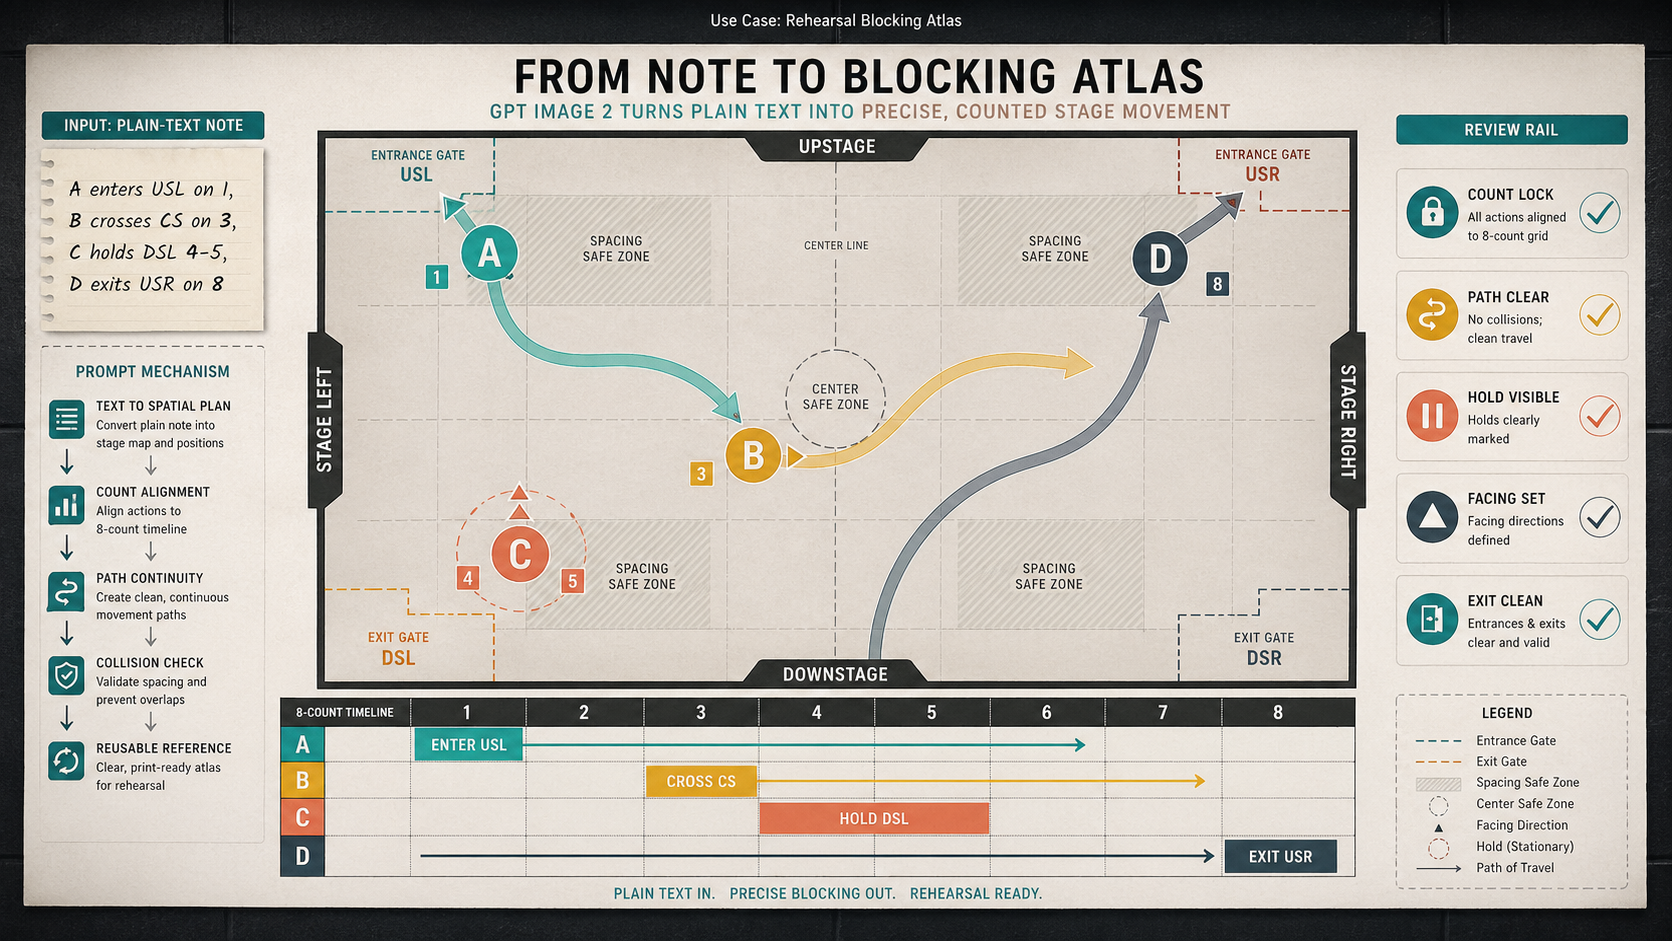
Create a wide 16:9 fictional rehearsal planning artifact titled visually only in small text as "Use Case: Rehearsal Blocking Atla...
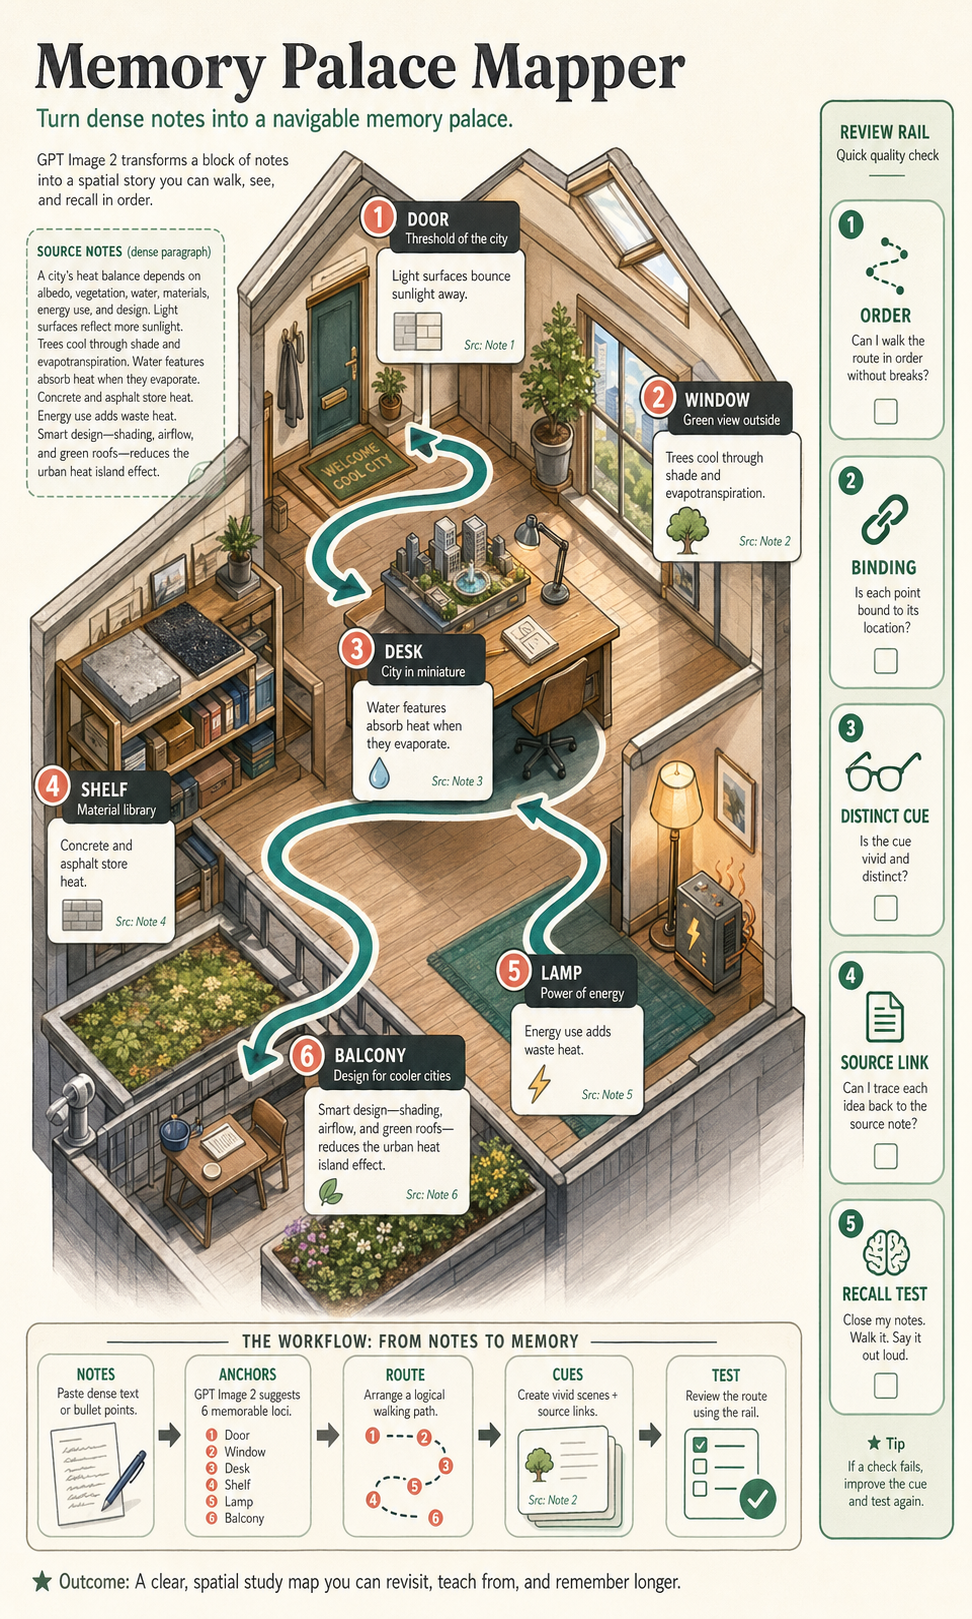
Create a polished, public-gallery image for GPT Image 2 use-case research. Use case: scientific-educational / productivity-visual...
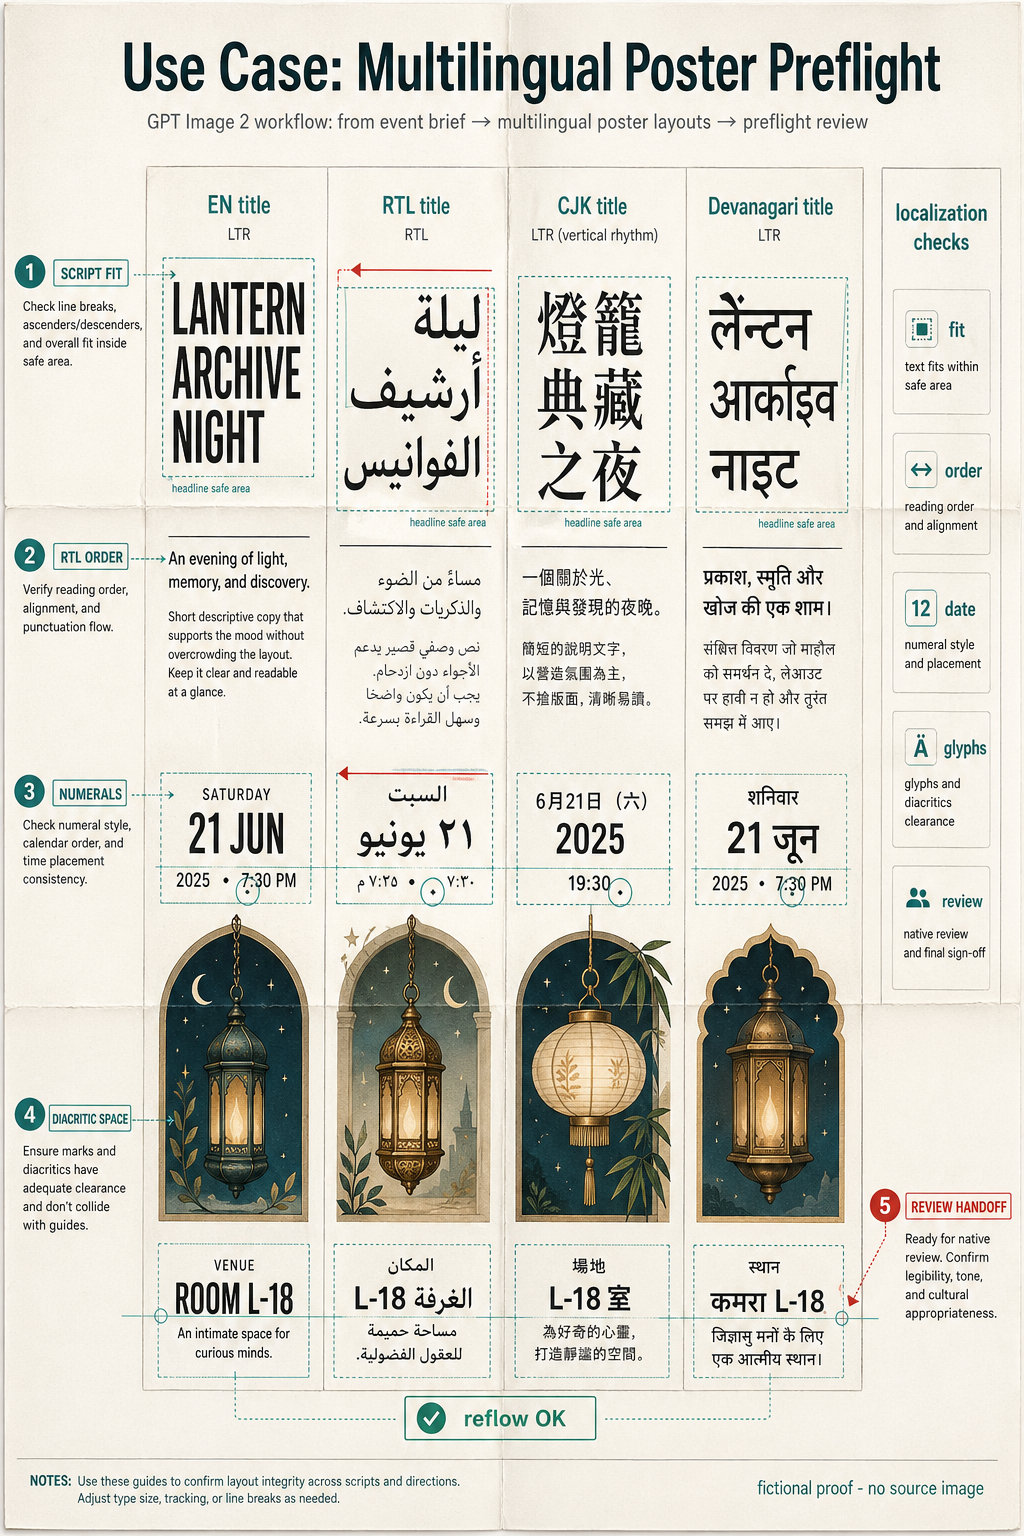
Create one polished public-gallery concept image titled exactly "Use Case: Multilingual Poster Preflight". Use case: localization...